Security Onion
This article is currently out of date and needs to be re-written. This is being kept around as reference for an updated article when Network Proposal V2 has been implemented and Security Onion is setup and reconfigured
Security onion is a SIEM (Security Information and Event Management) tool which aggregates, analyzes, and correlates data collected from endpoints and network traffic to help detect threats. It offers a wide range of tools which will help manage and monitor my network for any suspicious activity.
"For network visibility, we offer signature based detection via Suricata, rich protocol metadata and file extraction using your choice of either Zeek or Suricata, full packet capture via Stenographer, and file analysis via Strelka. For host visibility, we offer the Elastic Agent which provides data collection, live queries via osquery, and centralized management using Elastic Fleet. Intrusion detection honeypots based on OpenCanary can be added to your deployment for even more enterprise visibility. All of these logs flow into the Elastic stack and we've built our own user interfaces for alerting, hunting, dashboards, case management, and grid management." (Security Onion)
Current Configuration
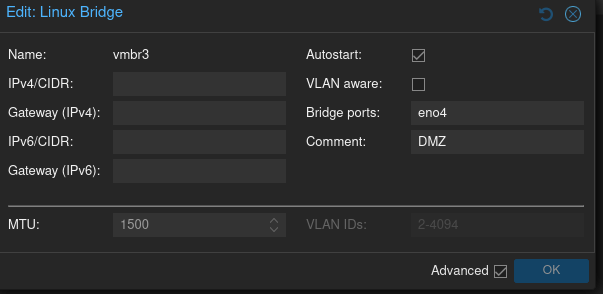
Currently, all of my bridges for VMs/outputs to switches are Linux bridges. The problem with these Linux bridges is that they cannot be configured to output to a SPAN or TAP port without very janky and unwieldy methods. The DMZ configuration is shown below and will be the first interface to be migrated over to OVS bridges
Proposed Configuration
To properly setup security onion I need a management port and a SPAN/TAP port to funnel network traffic into the instance.
Shown below is a much more granular diagram of the network (now with security onion included) compared to the diagram shown in my Network Proposal.
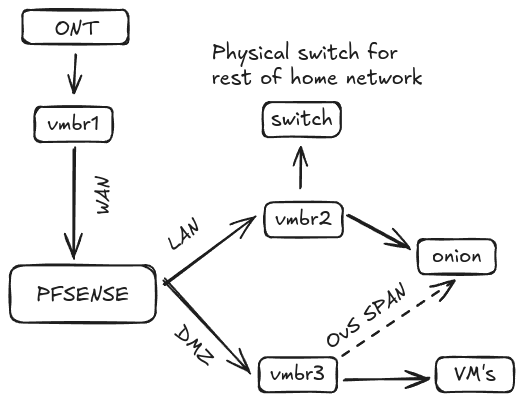
Security onion will be connected to the LAN for management access and will be connected to the DMZ via a OVS SPAN/TAP port to analyze traffic going through that network. This will let me analyze if any suspect network traffic is happening within the DMZ network. End points will also be managed with Wazuh and Osquery to gain the maximum amount of visibility in my network
Installation + Hardware requirements
Security onion will be installed on a VM under proxmox using the ISO image provided by Security onion. There are a couple types of installations and architectures to choose from, all with different use cases and applications. The two that I am most interested for my setup is the Eval and Standalone. Below are the hardware requirements for each architecture:
| Node Type | CPU cores | RAM | Storage | NICs |
|---|---|---|---|---|
| Eval | 4 | 8GB | 200GB | 2 |
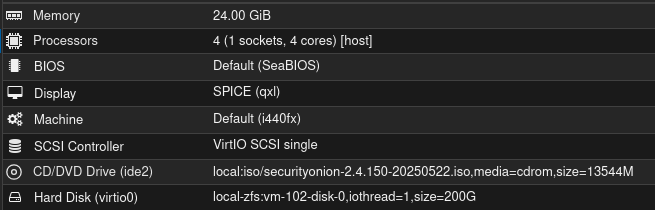
| Standalone | 4 | 24GB | 200GB | 2 |
| These two allow for the sniffing of packets from a SPAN/TAP. The Eval architecture is usually for testing out Security onion and doesn't fully meet my needs. So I will be going with the Standalone architecture. |
"However, instead of Elastic Agent sending logs directly to Elasticsearch, it sends them to Logstash, which sends them to Redis for queuing. A second Logstash pipeline pulls the logs out of Redis and sends them to Elasticsearch, where they are parsed and indexed. This type of deployment is typically used for testing, labs, POCs, or very low-throughput environments. It’s not as scalable as a distributed deployment."Security Onion
Following the hardware requirements for my VM leads me to this configuration:
Configuring the SPAN port
Manual + explanation
Automated + script setup
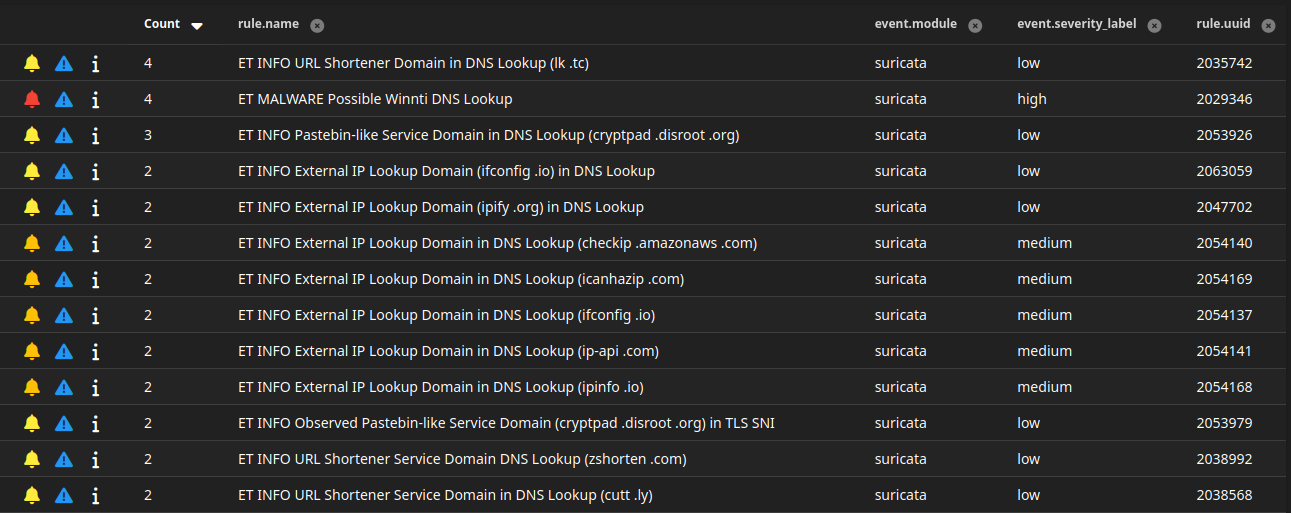
Testing Installation

Endpoint Agent installation
Linux
Windows
References
https://bilk0h.com/posts/security-onion-proxmox-open-vswitch#reference
https://www.youtube.com/watch?v=BA6wuWM9acY&t=1151s
https://youtube.com/playlist?list=PLljFlTO9rB155aYBjHw2InKkSMLuhWpxH&si=bgR5S-pkkExnBWEL
https://vext.info/2018/09/03/cheat-sheet-port-mirroring-ids-data-into-a-proxmox-vm.html#full-post
https://www.openvswitch.org/
https://docs.securityonion.net/en/2.4
https://pve.proxmox.com/wiki/Open_vSwitch#Bridges